Table of Contents
In this post series, we are going to fully reverse the inner working of a Visual Basic packer, used at least by some Cerber ransomware sample. My whole methodology, meaning each and every step I took, will be documented here. We’ll end up with a complete view of the whole unpacking process before the actual payload is started, and I hope it will help you learn to do this on your own !
Finding the malicious code
I “found” this sample on malware bazaar : https://bazaar.abuse.ch/sample/eebc9333049be75082af1cb0c8ecb798bcbea50e4b0208fa97a96c71aa68dc62/.
Looking at the code in IDA, it was obviously packed, so I embarked on a journey to get the final payload, and understand how the packer works.
WARNING : this is obviously a real malware, it WILL encrypt your files. Be careful if you decide to take a look 🙂 And if you run it, I sugges to mute your sound (it speaks !).
Note : this is a 32 bits binary, keep that in mind when we’ll be reading Windows internal structures.
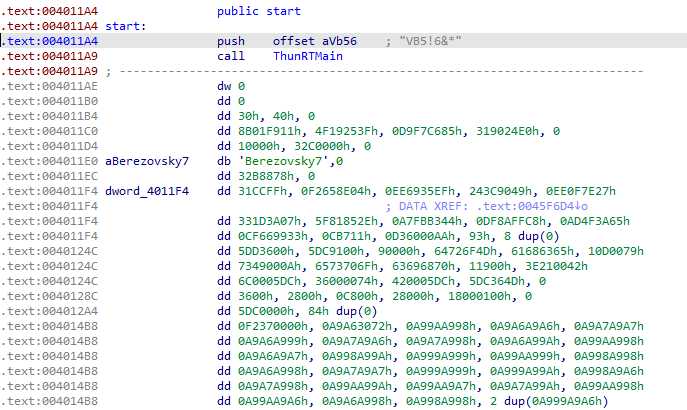
We find at the entry point a classic VisualBasic entry :
A structure address is pushed on the stack, then the VB virtual machine is called, and will run the sample. The difficulty here is we are not looking at x86 code, but VB virtual machine code, which would require specific analysis to understand.
I tried different VisualBasic disassembler, but none gave me a “good looking” code : it would seems there is not that much VB code in there after all. Something is clearly going on here.
Dynamic analysis
A small dynamic analysis always gives some interesting input, so let’s give procmon a go. We can see some process being created :
The sample starts a first process, and then restart itself with cmd.exe, with a command line parameter. What I assume here, is that it unpacks itself in a child subprocess (process injection ?), and runs itself again with a necessary parameter (the second execution also triggers the UAC).
Let’s note where the CreateProcess happened (looking at the call stack) :
So, it’s called by code, called itself by the VB vm. This code section does not seem to be linked with a module, that could mean it was created by VirtualAlloc, which would indicate this is some sort of first stage unpacked code.
Unpacking fast and easy
Now, if I wanted to go the fast way, I would open my debugger (x64dbg), hide it (dbh command), place breakpoints on some functions like :
CreateProcessWNtMapViewOfSectionNtWriteProcessMemoryNtSetContextThreadNtResumeThread
I would see this is clearly a process hollowing (as we could expect), extracting the payload is then fairly easy (like dumping the process before the NtResumeThread), and I would be done unpacking. But that’s not the point, I want to go for the full inner working 🙂
Getting to the unpacking code
Now I want to find the jump to the unpacked section, the one calling CreateProcessW, and also how this section was created in the first place. I don’t know where this section is allocated, but I know where the jump is, thanks to the stack trace of CreateProcessW. procmon gives us the Virtual Address of the call, as well as the address of the module :
That means we can now find the RVA in the module, and easily put a breakpoint on it, wherever it is placed.
In the debugger, the module is placed at 0x711c0000, so the call return address is at : 0x711c0000 + 0x37bba = 0x711f7bba, and so we break here :
Let’s run the sample : breakpoint is reached, step into (F7), and here we are :
This is not what I expected : I stopped here the execution expecting to end in an allocated buffer, as the stack trace suggested. I end up back in the sample code. Very interesting.
Finding the shellcode entry
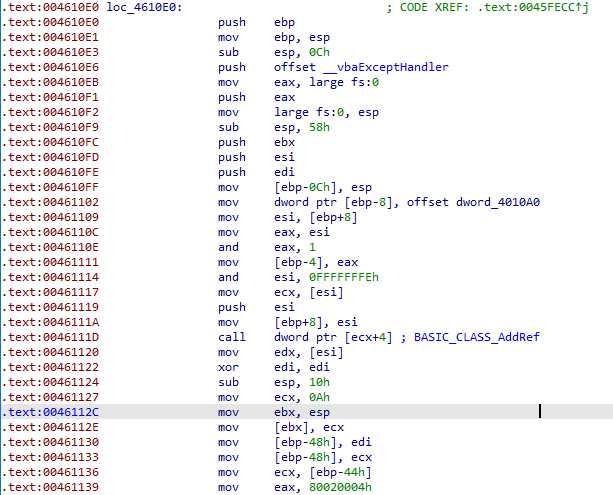
We end up on a jump, which goes on x86 code we can start make sense of :
This still looks like VB compiled code : it calls a lot of VB related functions, adds a SEH handler, … Starting here, placing a breakpoint on VirtualAlloc and VirtalAllocEx is interesting, should we miss something.
Continuing the execution, there is this basic block which looks promising :
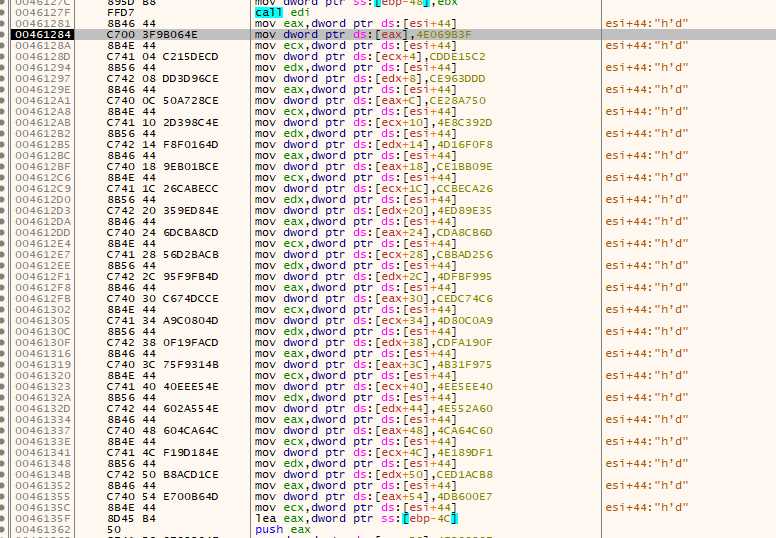
But it is not x86 code, so it would seem to be just another VB structure.
We continue, and enter this call at the end, the only one that doesn’t call the VB VM :
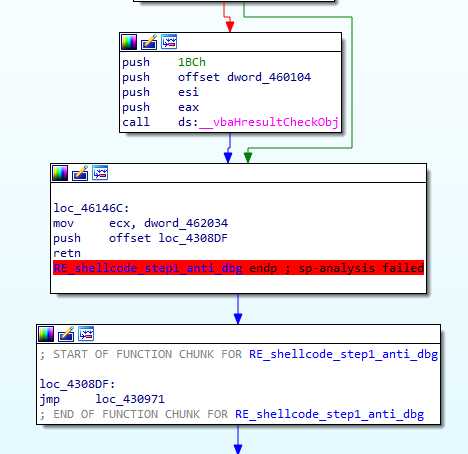
This function continues to call VB functions. There is some nice job done by IDA :
It detected the push/ret pattern, and treated it like a jump, that’s nice.
And those 2 instructions, are actually the beginning of the malicious code. That’s the first time we read x86 assembly that no compiler would ever produce, which is a very strong indication of suspicious code.
Basic protections
Anti debugging
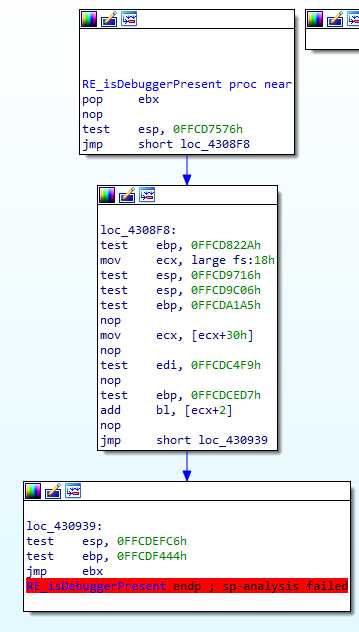
The malicious code starts by calling a function, checking if a debugger is attached :
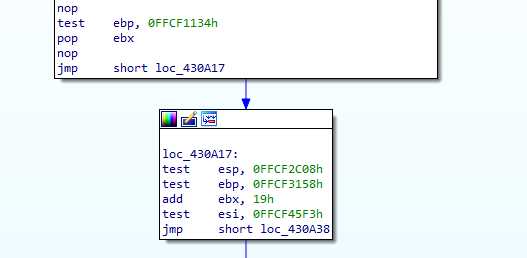
This simple code is very typical to the rest of the sample. All the test instructions are useless, they may be caused by some VB structure, necessary for the packing, but we can ignore them completely.
What this function does is take the TEB address from the TIB (reminder : it’s a 32 bits binary) :
mov ecx, fs:0x18
Get the PEB address from the TEB :
mov ecx, [ecx+0x30]
and finally get the BeingDebug flag :
add bl, [ecx+2]
Now, this is where I find this function interesting : ebx was poped from the stack at the beginning : it’s the return address. If the program is being debugged, the return address is shifted by 1 (true flag in the PEB), which results in jumping over incorrect instructions at the ret, and crash the program.
This is the normal call site :

But if the debugger is detected, we end up shifted by one byte :

Obvious segfault here ! That’s a neat trick. Protecting against this is one of the things done by the dbh command in x64dbg.
Anti AV detection
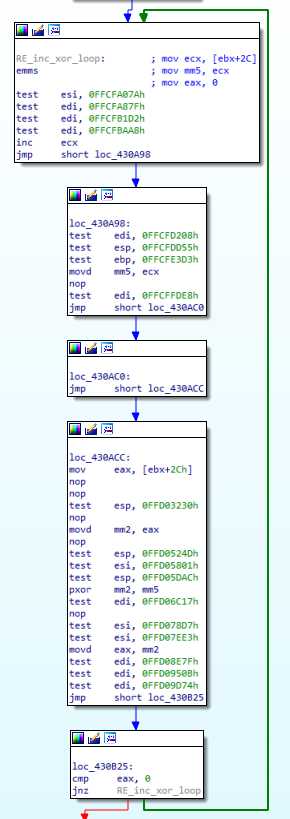
After the debugger detection, there is this loop :
It does … well … nothing. This is one a few times where useless or unnecessary instructions are added, I guess to lose time, and bypass an AV which would only analyze the program memory for a few seconds after it started. And we’re looking at a 4 billions loop turn here.
Calling external functions
Pushing a structure on the stack
We end on another call, but the return site is invalid :
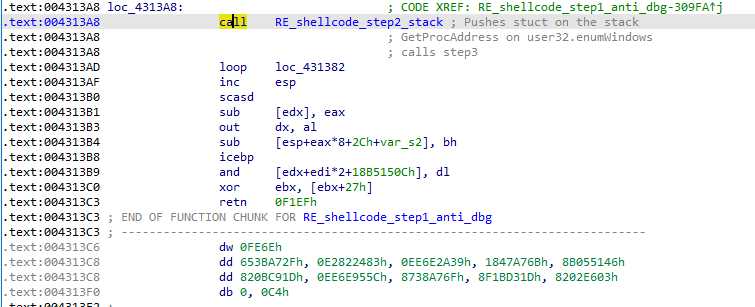
call is often used to push addresses on the stack in shellcode, and that is the case here. It is immediately pop in ebx by the called function (as was done before). ebx is then moved by 0x19 :
It loops through ecx to find the value which, XORed with [ebx+0x2c], is zero. This is again anti AV technique, because this value is easy to know, it is [ebx+0x2C] … Again, a whole loop for nothing, or not much at least.
The ecx value ends up in mm5 register, then moved in esi, and is used just after as a XOR key :

0x48 bytes are pushed on the stack, and xored with esi. And that’s the result :

And here is what it is and means. We’re going to see later how it is used, and how we can determine what some of the fields are :
| Offset | Type | Content |
|---|---|---|
| 0x0 | DWORD | searching start address (= .text segment address) |
| 0x04 | QWORD | 8 first bytes of the code of msvbvm60.DllFunctionCall |
| 0x0C | DWORD | 0x40000, 4th parameter for DllFunctionCall |
| 0x10 | DWORD | XOR key |
| 0x14 | BYTES[12] | “kernel32” |
| 0x20 | BYTES[12] | “VirtualAlloc” |
| 0x2C | DWORD | 0x0 : terminator for “VirtualAlloc”, and key for XOR |
| 0x30 | BYTES[8] | “user32” |
| 0x38 | BYTES[12] | “EnumWindows” |
Importing external functions
Another function is called after that, with the following state :
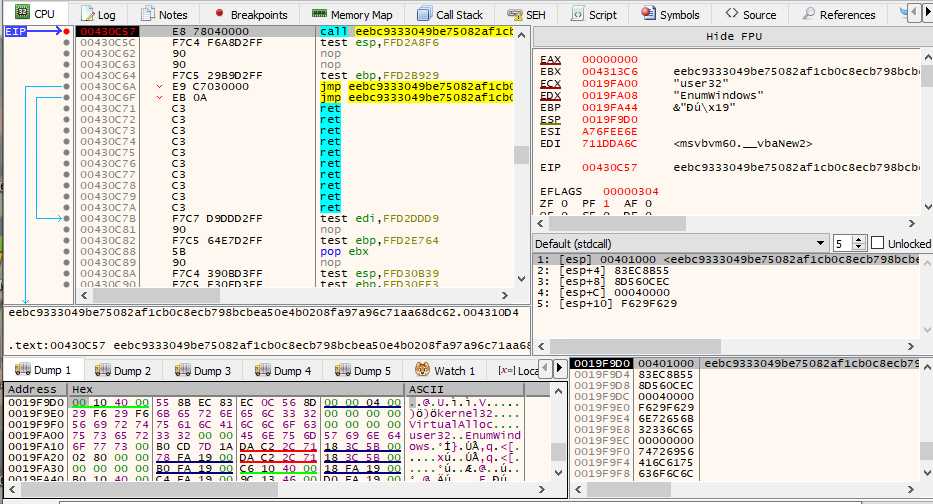
Looking at ecx and edx value, we can take a good guess as to what is going to happen.
This function is so lost between the test instructions, that showing it here would not be very helpful.
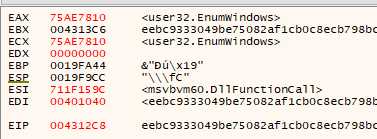
Basically is reads the first DWORD on the stack, and start searching at this address for the next QWORD on the stack, which happens to be the first 8 bytes of the DllFunctionCall function. This VB function imports a module, and returns the desired function address. This is a LoadLibrary and GetProcAddress, all in one. It’s parameter have nothing of interest, one of them is read from the previously pushed structure. Let’s just note that we have the function address in eax at the end, which is very easy to notice in the debugger :
Finalizing the unpacking
Anti sandbox protection
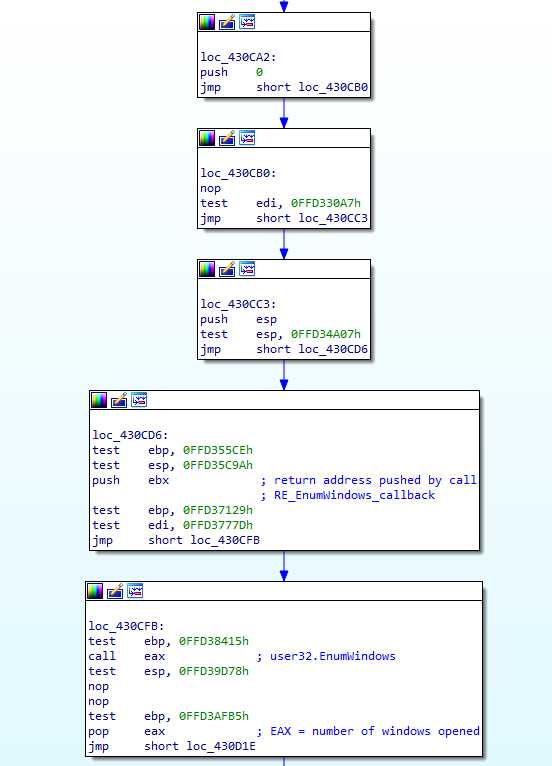
Another call and pop ebx after, the user32.EnumWindows function we just imported is being used :
First, 0 is pushed on the stack, then esp : meaning we just pushed an int*. Then ebx is pushed, and EnumWindows is called.
A look at its documentation tells us that its first parameter is a function pointer. It the address pushed by the previous call, so let’s check what was following it :
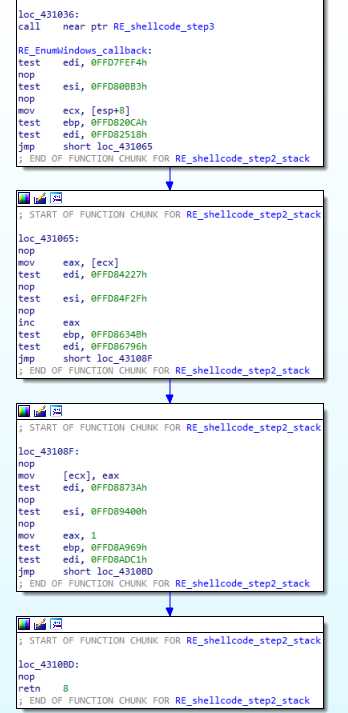
After the call is a function that reads a pointer, increment its value, and returns True to continue.
Basically, we are counting the number of windows, and then compare it to 0xB :
If there are less windows, well, we directly jump to the following call to the loading function (the one using DllFunctionCall), and it will fail :
If there are more windows, the “kernel32” et “VirtualAlloc” strings are loaded in ecx and edx, before the DllFunctionCall call which will work as expected.
This is an anti sandbox check : the malware is checking that it is running in a full environment, will a real user. If the 0xB value has a special meaning, I do not know …
VirtualAlloc, and final jump
After that, VirtualAlloc is naturally called, with a size of 0x5000, and yet another call / pop is made.
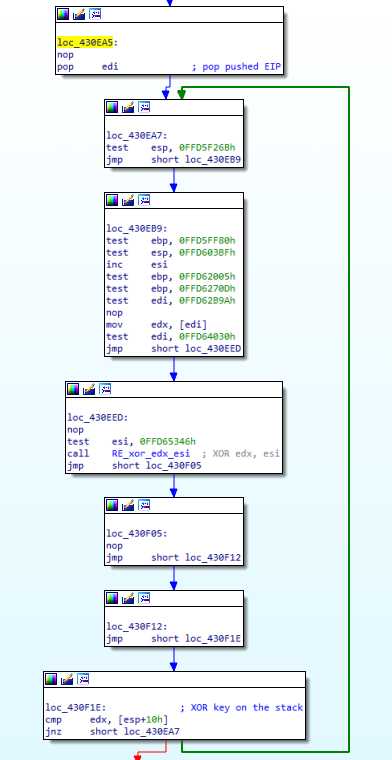
The return address of the call is poped in esi : this is the payload to unpack. Then there is another loop, doing a lot of operations just to resolve a simple xor :
This code searches for a XOR key in esi, which is increased until [edi] xor esi = [esp+0x10], where esp still points to the previous pushed structure, so we’re using the XOR key at offset 0x10.
This whole loop is equivalent to a simple xor operation (esi = [edi] xor [ esp+0x10]).
Note : I say it is a XOR, but it’s actually a call (to a function just making a xor). This encryption function could be made way more complex than a XOR, and this “key searching loop” would keep working. I guess that’s the malware author idea here. It is worth to note that the “XOR key” pushed in the stack structure is actually the first 4 bytes of the packed payload. This whole process is actually an arbitrary 4 bytes block decryption procedure, brute forcing it’s own key.
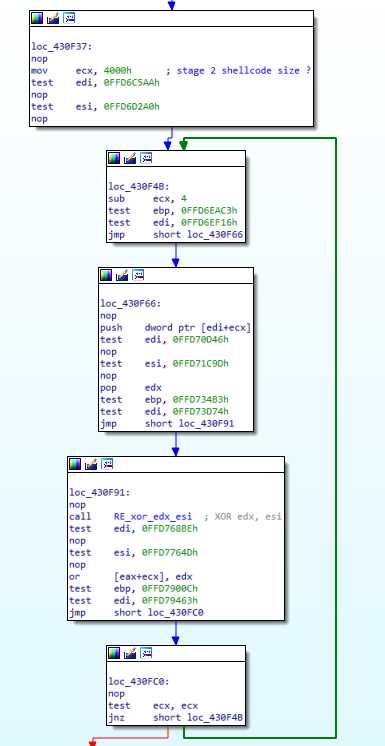
Once the correct esi key is found, the payload buffer is xored and copied in the allocated buffer (still in eax):
We can note that the allocated buffer size was 0x5000, but only 0x4000 bytes are copied.
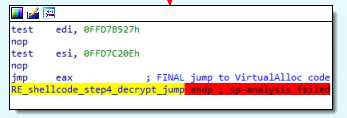
We end on a jmp eax, that will bring us to the unpacked payload :
Conclusion
There is nothing really complex going on here, the main difficulty comes from Visual Basic, which hides the malware entry point and is forcing the malware author to write code by very little pieces, thus making the assembly a bit harder to read.
All pushed eip are poped, which explains why those functions did not appear in the CreateProcess call stack in procmon.
Now take a break, drink a cofee, and I’ll see you in this next post the rest of the analysis 🙂

