Table of Contents
In this second part, we’ll reverse the second unpacking stage of the Cerber sample, and get to the final payload. We’ll be dealing with some binary protections, custom structures, and process injection. Let’s get started !
This post follows this first part. I will not go into as much detail as before for this part, most of the tricks sed in the sample have already been dealt with in the first part. However, the protections and algorithms used by the unpacking stub will be detailed and explained fully.
This is a shellcode, extracted from a VB file. 2 things to note there :
* It uses many tricks common to shellcode, and IDA handle a bunch of them very, very badly.
* Those blocks that seems to be forced by the VB file structure are still there, but we won’t be dealing with all those test instruction anymore, and that’s a relief.
General structure
First thing I did was a bit of a cleanup, after disabling IDA auto analysis and manually tell it what is code, and what is not (the code is not that long).
There is still this block structure, probably because of VB constraints, as we can see in IDA memory view :
Only small portions of the memory ca be put in a function, the rest have jumps on callback, and putting that in a proper function messes everything in IDA. That’s why there is so much red, and little blue …
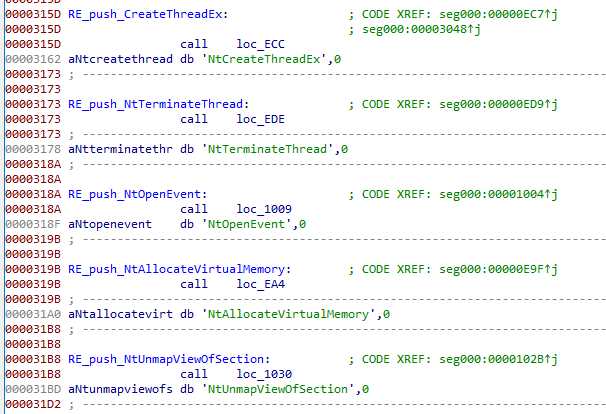
We find some functions and module strings being pushed by call instructions :
Following Xref on the call, we see a pattern emerge: when the shellcode needs a string, it jump on te call, and the call bring it back right after the jump. It’s then very easy to see when a string is used (just follow the call pushing it).
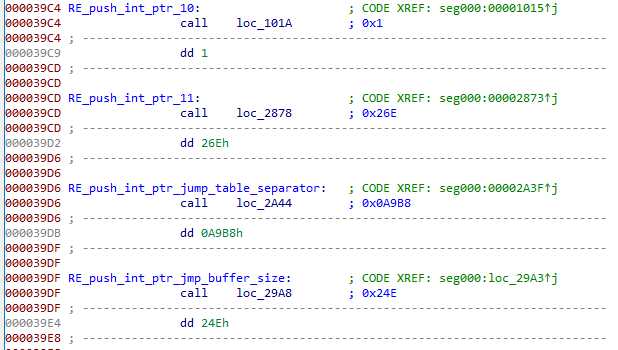
There are also a few (12 actually) int pointer pushed this way :
I identified the use for some of them, but not all. It looks a lot like a configuration to me : some are boolean activating certains functionalities, some are used as encryption keys. I’ll reference them as “int* parameter” in the rest of this post.
There are 70 pushed references like this in total, and not everything semms to be used : it may have been recycled from somewhere else.
Imports
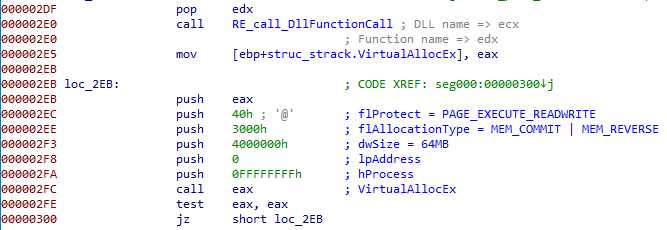
The execution starts by placing “kernel32” in ecx and “GetTickCount” in edx. Yes, this is going exactly the same way as the first stage.
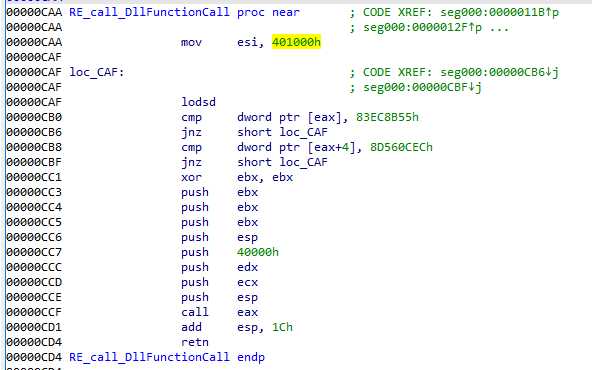
This is the same call to DllFunctionCall as the first part, except this time it is much easier to read. Everytime a function needs to be imported, the malware looks for the DllFunctionCall address, which is not very performant, but the imported function address are always saved (when not used only once). This type of code is repeated dozens of time :
There is no more structure pushed on the stack, after a XOR, like before.
Protections
Now that we can read function call, we can understand the rest of the shellcode. The execution starts by anti debug and anti sandbox protection. A fair amount of them.
Sleep checking
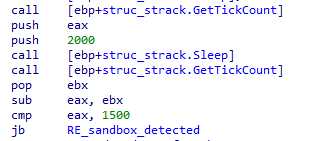
First one checks if Sleep calls are indeed pausing the execution :
If after sleeping 2 seconds, system time moved of less that 1.5s (sandboxes skip sleep time to avoid losing time), then a sandbox is detected.
SetErrorMode checking
We have then a SetErrorMode based :
SetLastError returns the old value, and the shellcode checks that the value it inputs (0x800) is taken into account (checking for a sandbox that would not implement this behavior).
SetLastError checking
Right after that, we continue the collection of checks with SetLastError
This one simply uses SetLastError, and checks it has modified the corresponding field in the TIB. Again, the shellcode is checking the functionality of the potential sandbox it’s running into.
Cursor checking
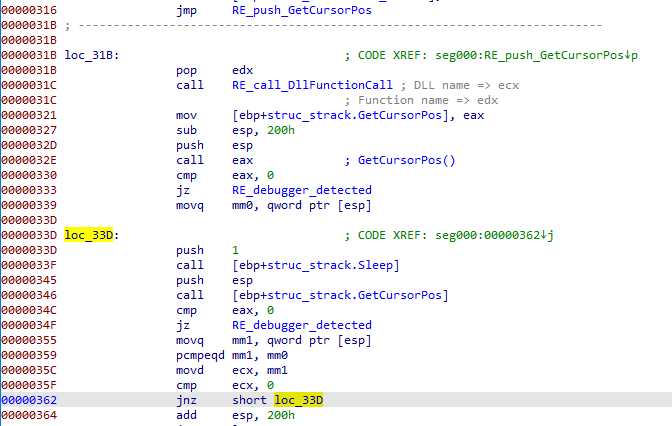
Then, we have a GetCursorPos based sandbox detection :
Basically, it checks if the cursor moves : it saves an original position, sleeps 1ms, and check the position again. And as long as the cursor position doesn’t change, it loops to sleep. That’s a simple anti sandbox technique.
NtGlobalFlags checking
The NtGlobalFlags field of the PEB is checked :
When the process is being debugged, it’s value is set to 0x70, which is detected here. This is bypass by x64dbg dbh command.
cpuid detection
An finally (yes, that’s the last), the shellcode checks the CPU capabilities using the cpuid instruction, with 1 in eax, and checks the 24th lowest bit of edx:
Looking at intel documentation :
When eax value is 1, edx return value is a bitfield :
Bits are numbered from 0, which means the sample is testing for the “MMX” bit. And I could not understand the exact reason here … So, if anyone has more information on this, don’t hesitate to comment 🙂
Ending the execution
In all the previous tests, you may have noticed there are 2 jump point for failure.
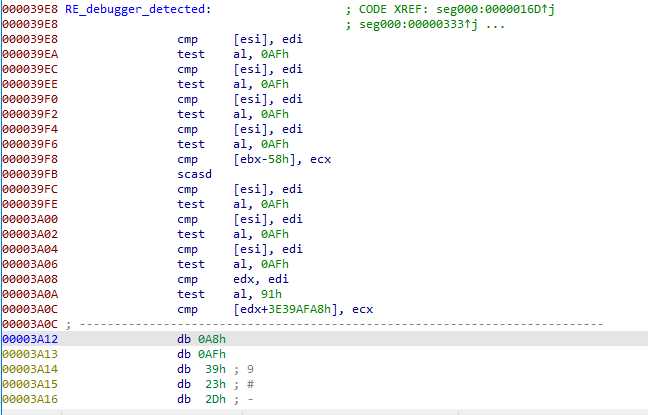
A first point I called “RE_sandbox_detected” bypasses many initialization, like memory allocation, dooming the rest of the unpacking to fail (segfault). It’s more subtle than the second one, which I named “RE_debugger_detected” : This one simply goes to bad instructions, at the very end of the shellcode.
Extracting the payload
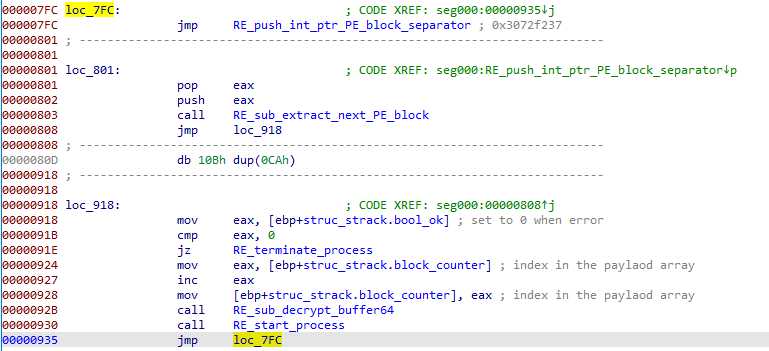
This shellcode can handle many payload. It cycle through the extraction like this :
The shellcode counts the payloads using a stack variable (which I named block_counter), and for each payload : extracts, decrypts and runs it.
3 functions are called one after the other, and we’ll walk through each of them, but let me give you the general idea before we begin.
General view
Here is a schema showing how the extraction is done :
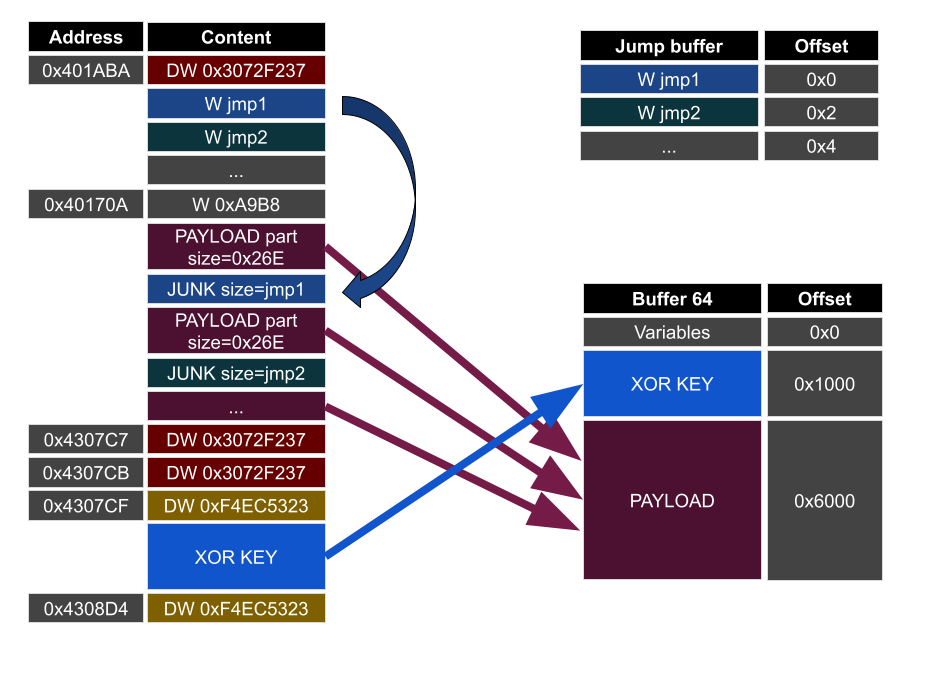
There are 2 buffer involved in the process :
A first one is 64 MB long (0x4000000) (I called it buffer64):
This one has 3 parts :
- from 0x0 to 0xfff : variables. Theses are used exactly the same as the stack variables
- from 0x1000 to 0x5fff : XOR block encryption key
- from 0x6000 : the payload (encrypted, and then decrypted on site)
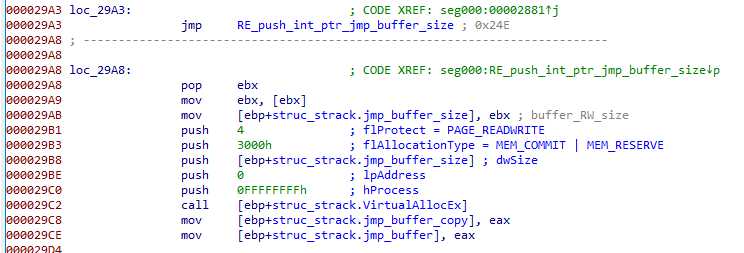
A second one is allocated, and it’s size is read from an “int* parameter” (one of the int* pushed by a call) :
I named it jump_buffer, you’ll understand why.
With that, and the schema in mind let’s see how the payload extraction works.
Payload extraction
Step 1 – XOR key extraction
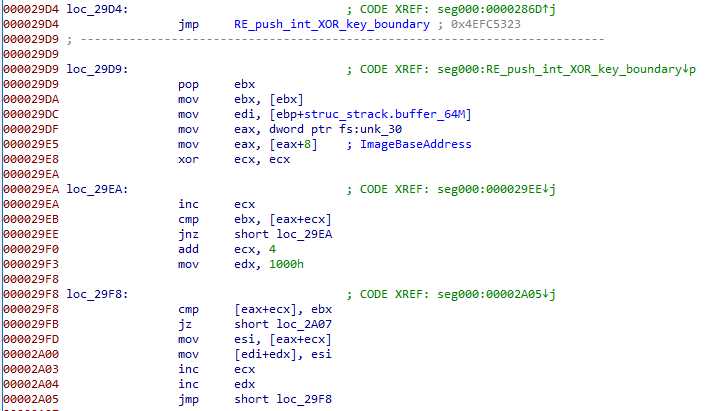
The shellcode starts by extracting the XOR block encryption key, placed in buffer64 at offset 0x1000.
It symply looks for a parameter DWORD (0xF4EC5323 for this sample) used as boundary.
Step 2 – Finding the payload in the array
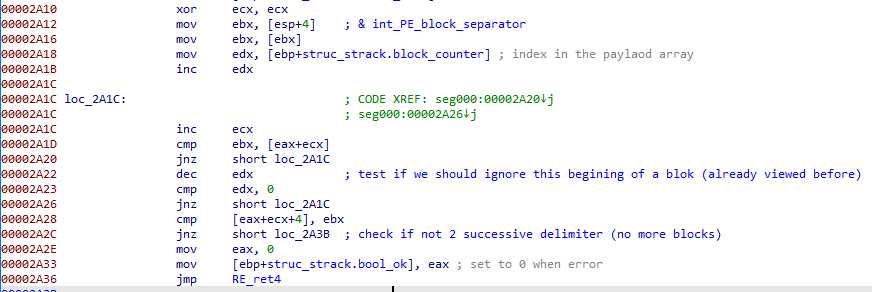
Then, it searches for another parameter DWORD (named PE_block_separator, 0x3072f237 here), ignoring the first block_counter appearances :
When the delimiter is found, it checks if there are another occurence right after, and if so, the execution end (this actually marks the end of the payload array).
What we are seeing here is simply an array, which every cell delimited by a DWORD, and ending with twice that DWORD. There is only one cell in our sample, but there could be more.
Note: there is a little “bug” over there. Addresses are incremented one by one, but bytes are copied 4 by 4, meaning there are 3 too much bytes copied at the end, a common mistake in assembly, with no consequence here.
Step 3 – Extracting the jump table
Each payload cell starts with a “jump table” : an array of WORD (16 bits), ending with a separator (another parameter DWORD I named jump_table_separator, with a value of 0xA9B8 here):
This table is copied in the jump_buffer, for later use.
Step 4 – Extracting the final payload
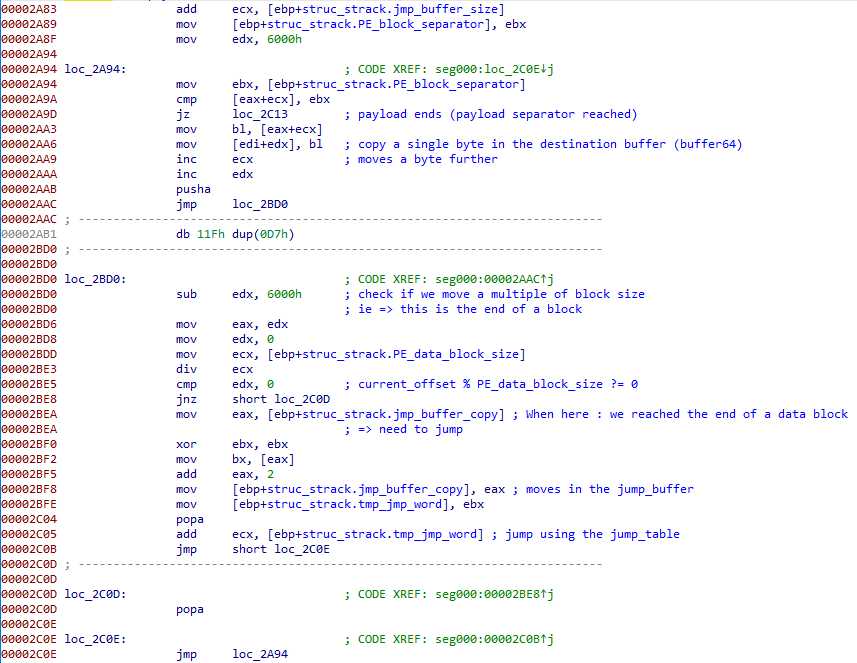
Now, this is where the magic happens. The following code concatenates all the payloads parts in buffer64 :
The issue here, and the reason for the jump table, is again Visual Basic. Those blocks we keeps seeing, they are dividing the payload as well.
There is a parameter int* that gives the block size (PE_data_block_size in my screen, 0x26E for this sample). This code copies blocks of that size, and when the block end, it jumps (ecx is incremented) of the next entry in the jump_table we extracted before. And the copy continues until reaching the PE_block_separator DWORD (0x3072F237).
Decryption
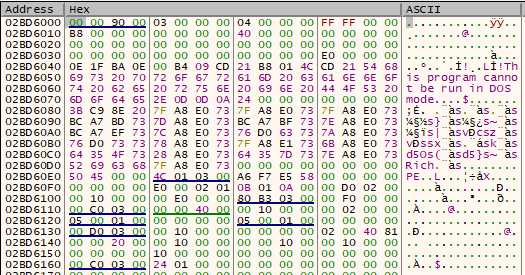
Once the extraction is done, the payload in decrypted on site in buffer64. This is a simple XOR, cycling through the XOR key extracted previously. There is nothing really special or worth noting here. The XOR is done using floating point registers, which may be odd but doesn’t change anything.
Notice the MZ bytes are absent at the beginning, probably to avoid automatic detection.
Payload execution
Checking for hooks
Before we go into the payload execution, some of the functions used by this shellcode are well known to be dangerous, and are monitored by antivirus software. And this shellcode actually defends itself against it !
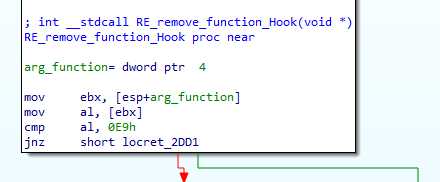
It checks if the functions in parameter start with 0xE9 : a “jump near” opcode. That would likely be a hook placed by the AV.
Then it searches for the next 0xE8 bytes, reads the words after, removes 1 to this word, and writes 0xE8 followed this new value over the hook :
Now let’s look at the address of NtWriteVirtualMemory for example :
If there is a hook, the mov eax,3A will not be there. So the shellcode searches for the next mov eax, takes it values (0x3B here), removes 1, and put it back where it belongs, overwriting the hook.
As you can see, for all those functions, eax is set to the internal syscall value for Windows, and there are placed in order in the memory. So reading the next function code, and decreasing its eax value will get us back our function eax value (overwritten by the hook).
This method would only work in ntdll, at the condition that the next function in memory is not also hooked.
4 functions are checked against hooks :
NtWriteVirtualMemoryNtTerminateThreadNtOpenEventNtResumeThread
Process hollowing
The final payload is executed through a classic process hollowing.
The application name is read on the PEB, the command line is obtained with GetCommandLineW, and a subprocess is created stopped :
Then the subprocess memory is unmapped :
New memory is allocated :
The MZ is partially added to the header :
And written in the subprocess memory :
Finally, the ‘M’ is written, alone :
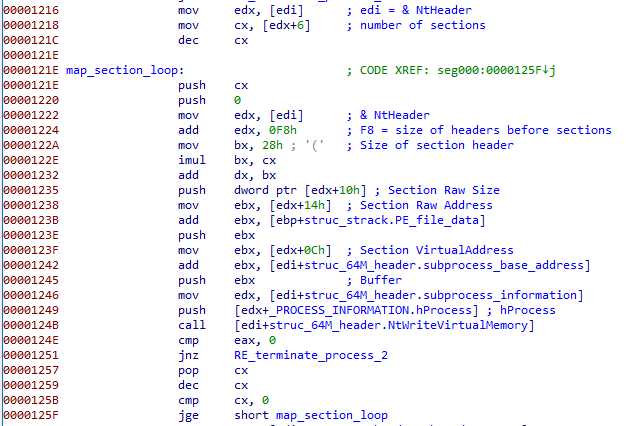
The sections are mapped (starting from the last) :
Then the subprocess thread is obtained :
The subprocess PEB address is read from EBX, and it’s ImageBase field is updated :
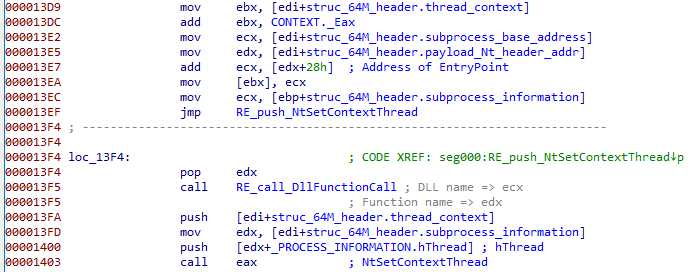
The entry point (in eax) is also updated, before settings the context back :
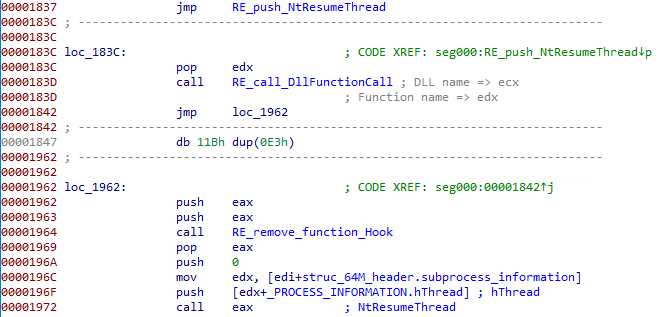
And finally, the subprocess execution is resumed :
Additional capabilities
There are many options in this shellcode, which can be activated through the “int* parameters”. I only gave it a fast look, but I believe the shellcode can write the payload in a file, instead of doing the whole process hollowing thing. There are also options to write registry keys, some calls to debugging functions, …
This really looks like a generic packer, capable of storing and launchin multiple payloads, and adapt to multple situations.
It could be worth it to take a look at the rest of the options, but that’s for another time 🙂
I hope those 2 articles gave you a better look at how packing works, and how to analyze a shellcode !












hi
thank you for the article